Why User Experience Matters in Digital Product Development
A product can work exactly as specified and still fail the people using it. Here is why user experience belongs at the start of a project, not the end.
31 Oct 2026 · 2 min read
Every meaningful solution starts with a conversation. Tell us what you want to achieve, the challenge you are facing, or the opportunity you want to explore. We will help you identify the right expertise and the next steps.
From the Blog
A product can work exactly as specified and still fail the people using it. Here is why user experience belongs at the start of a project, not the end.
31 Oct 2026 · 2 min read
Off-the-shelf tools are often the right choice. These are the signs that your business may have outgrown them, and the questions to ask before you build.
31 Oct 2026 · 2 min read
A clear technical drawing turns an idea into instructions that others can build and check. Here is what it does for a project before any material is cut.
31 Oct 2026 · 1 min read
Ovasis Design
The Animal Tracking Dashboard is a digital interface concept designed to help farmers, ranchers, wildlife managers, and animal monitoring organisations track and manage animals through a centralised platform.
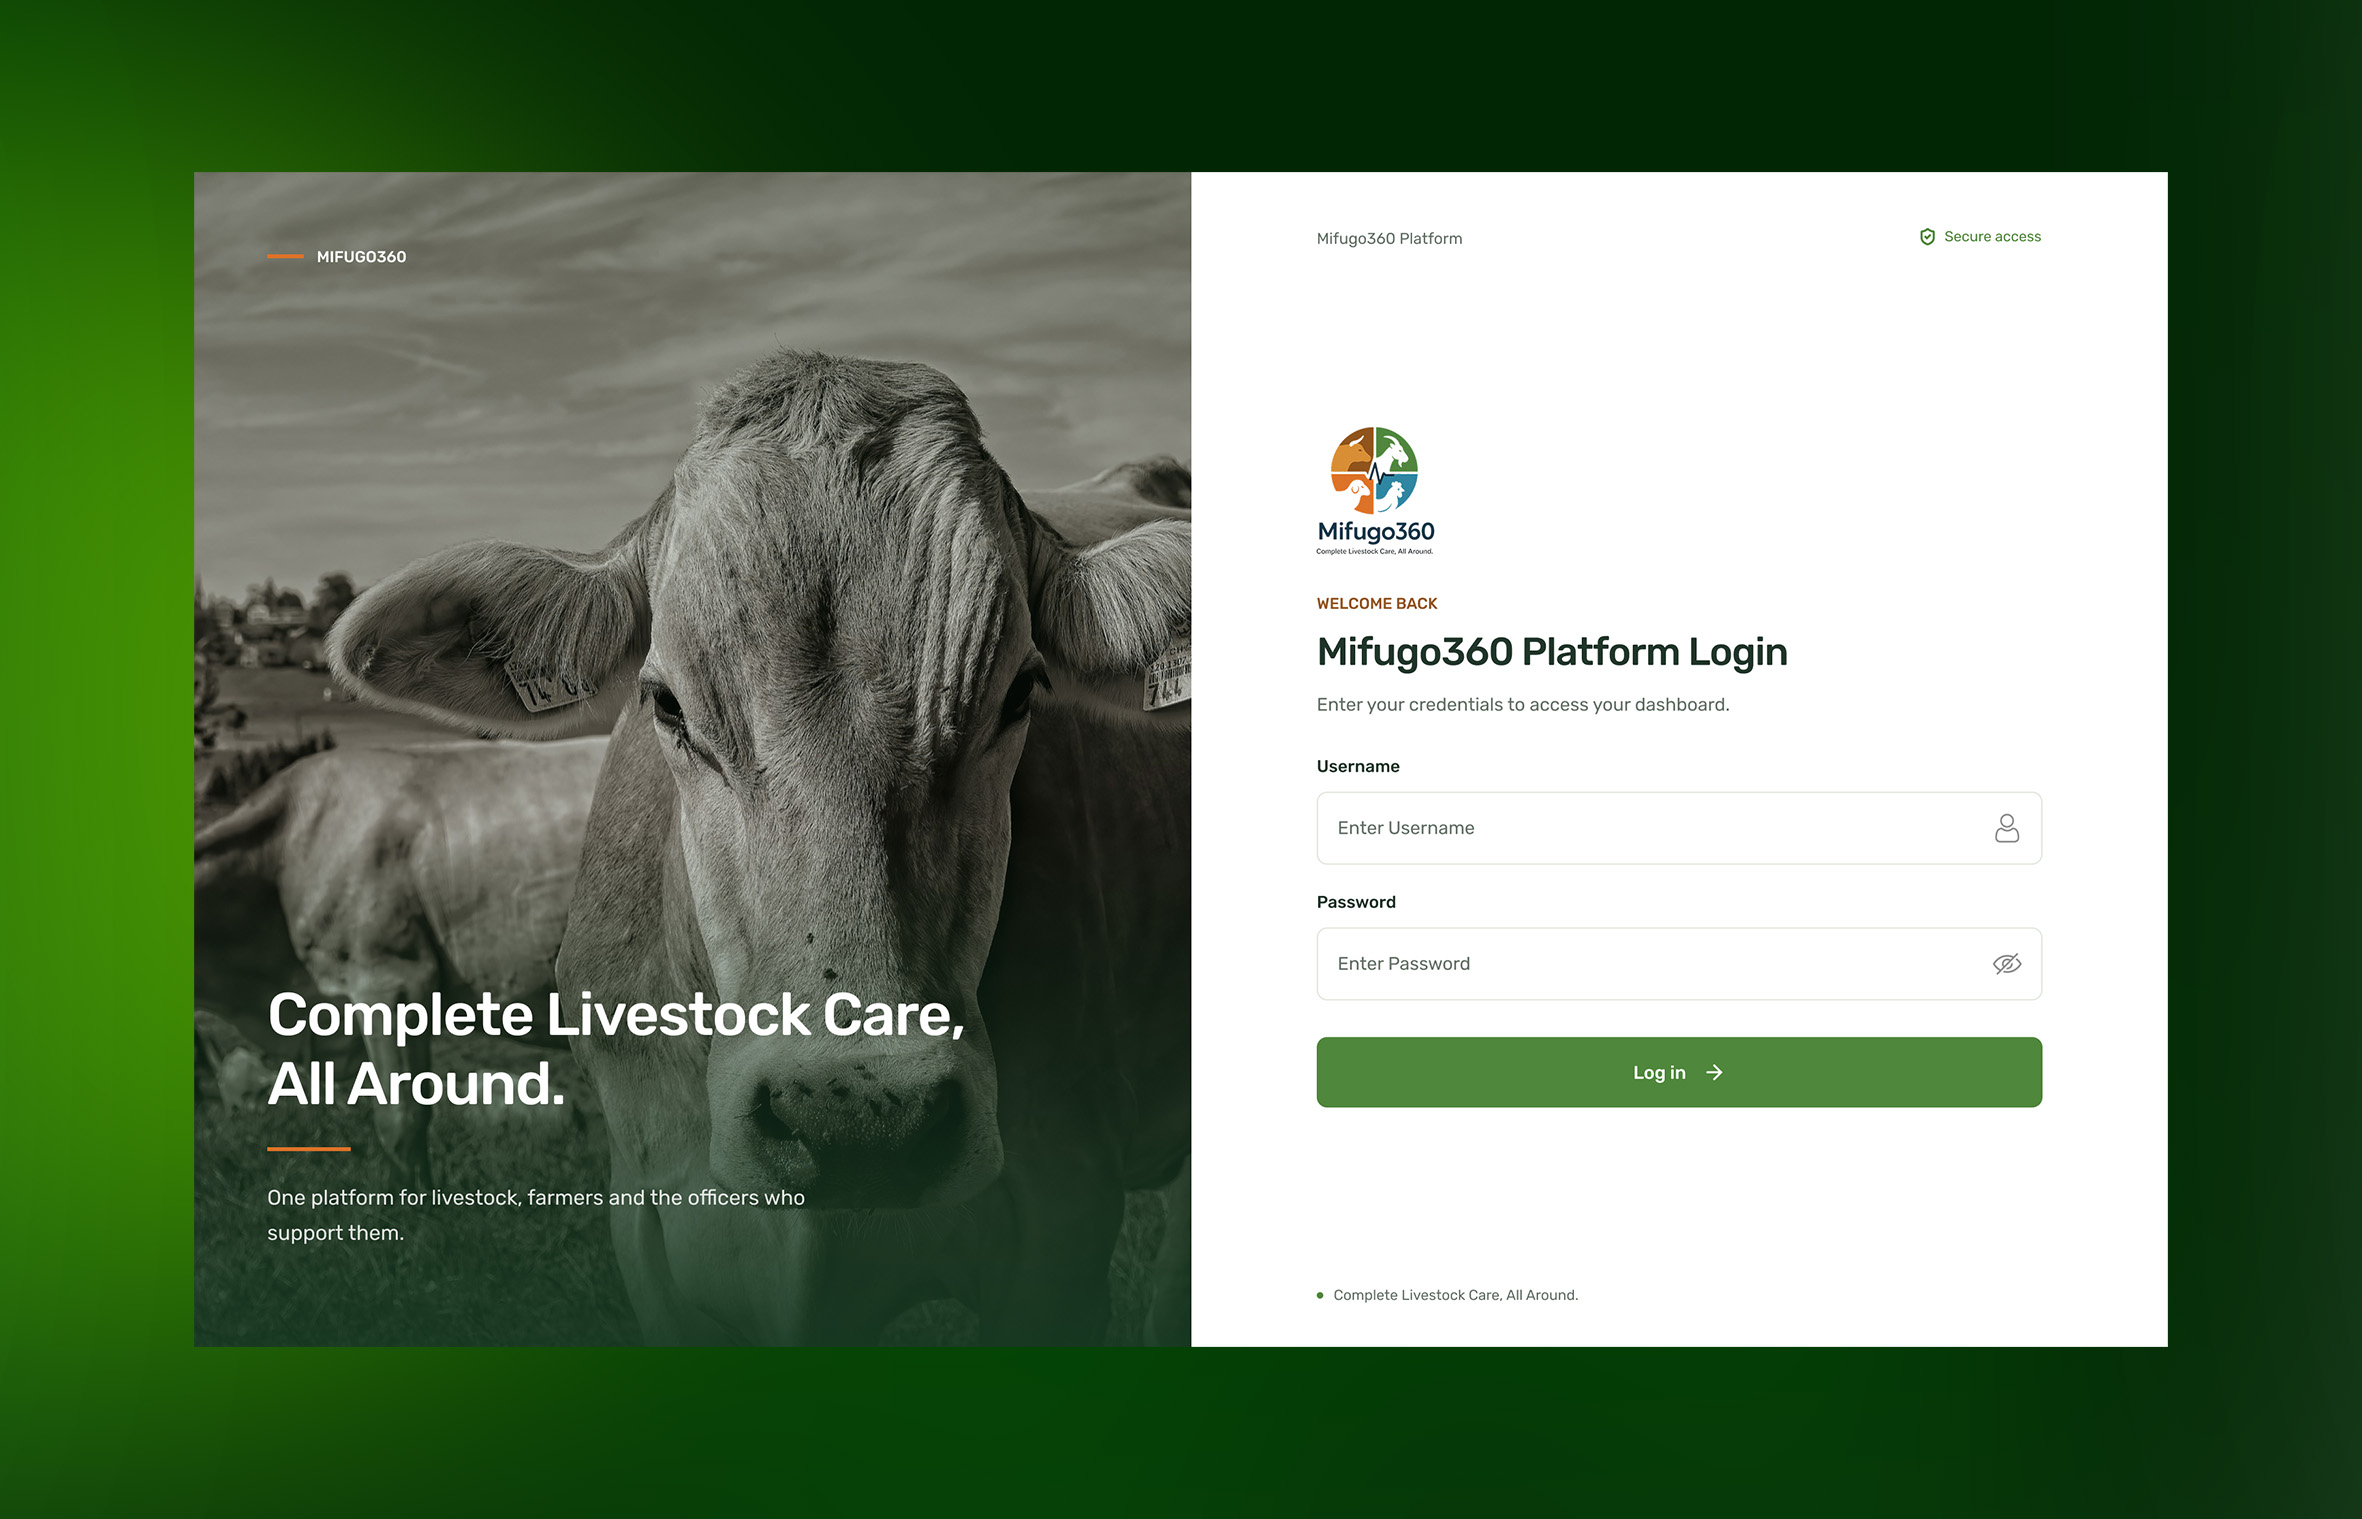
The Animal Tracking Dashboard is a digital interface concept designed to help farmers, ranchers, wildlife managers, and animal monitoring organisations track and manage animals through a centralised platform.
The design focuses on transforming location data and animal activity into meaningful visual insights, enabling users to monitor animal movements, review tracking information, and respond to important events from a single dashboard.
Our goal was to create an intuitive, data-driven interface that simplifies animal monitoring while providing a foundation for smarter livestock and wildlife management.
Monitoring animals across large geographical areas can be difficult, particularly when information is scattered across different systems or relies on manual tracking methods.
Users need a convenient way to identify animal locations, monitor movement patterns, review individual animal records, and detect unusual activity.
The challenge was to design a dashboard that presents complex tracking information in a simple, organised, and actionable format without overwhelming users with data.
We adopted a user-centred design approach, focusing on how users interact with animal tracking information and make operational decisions.
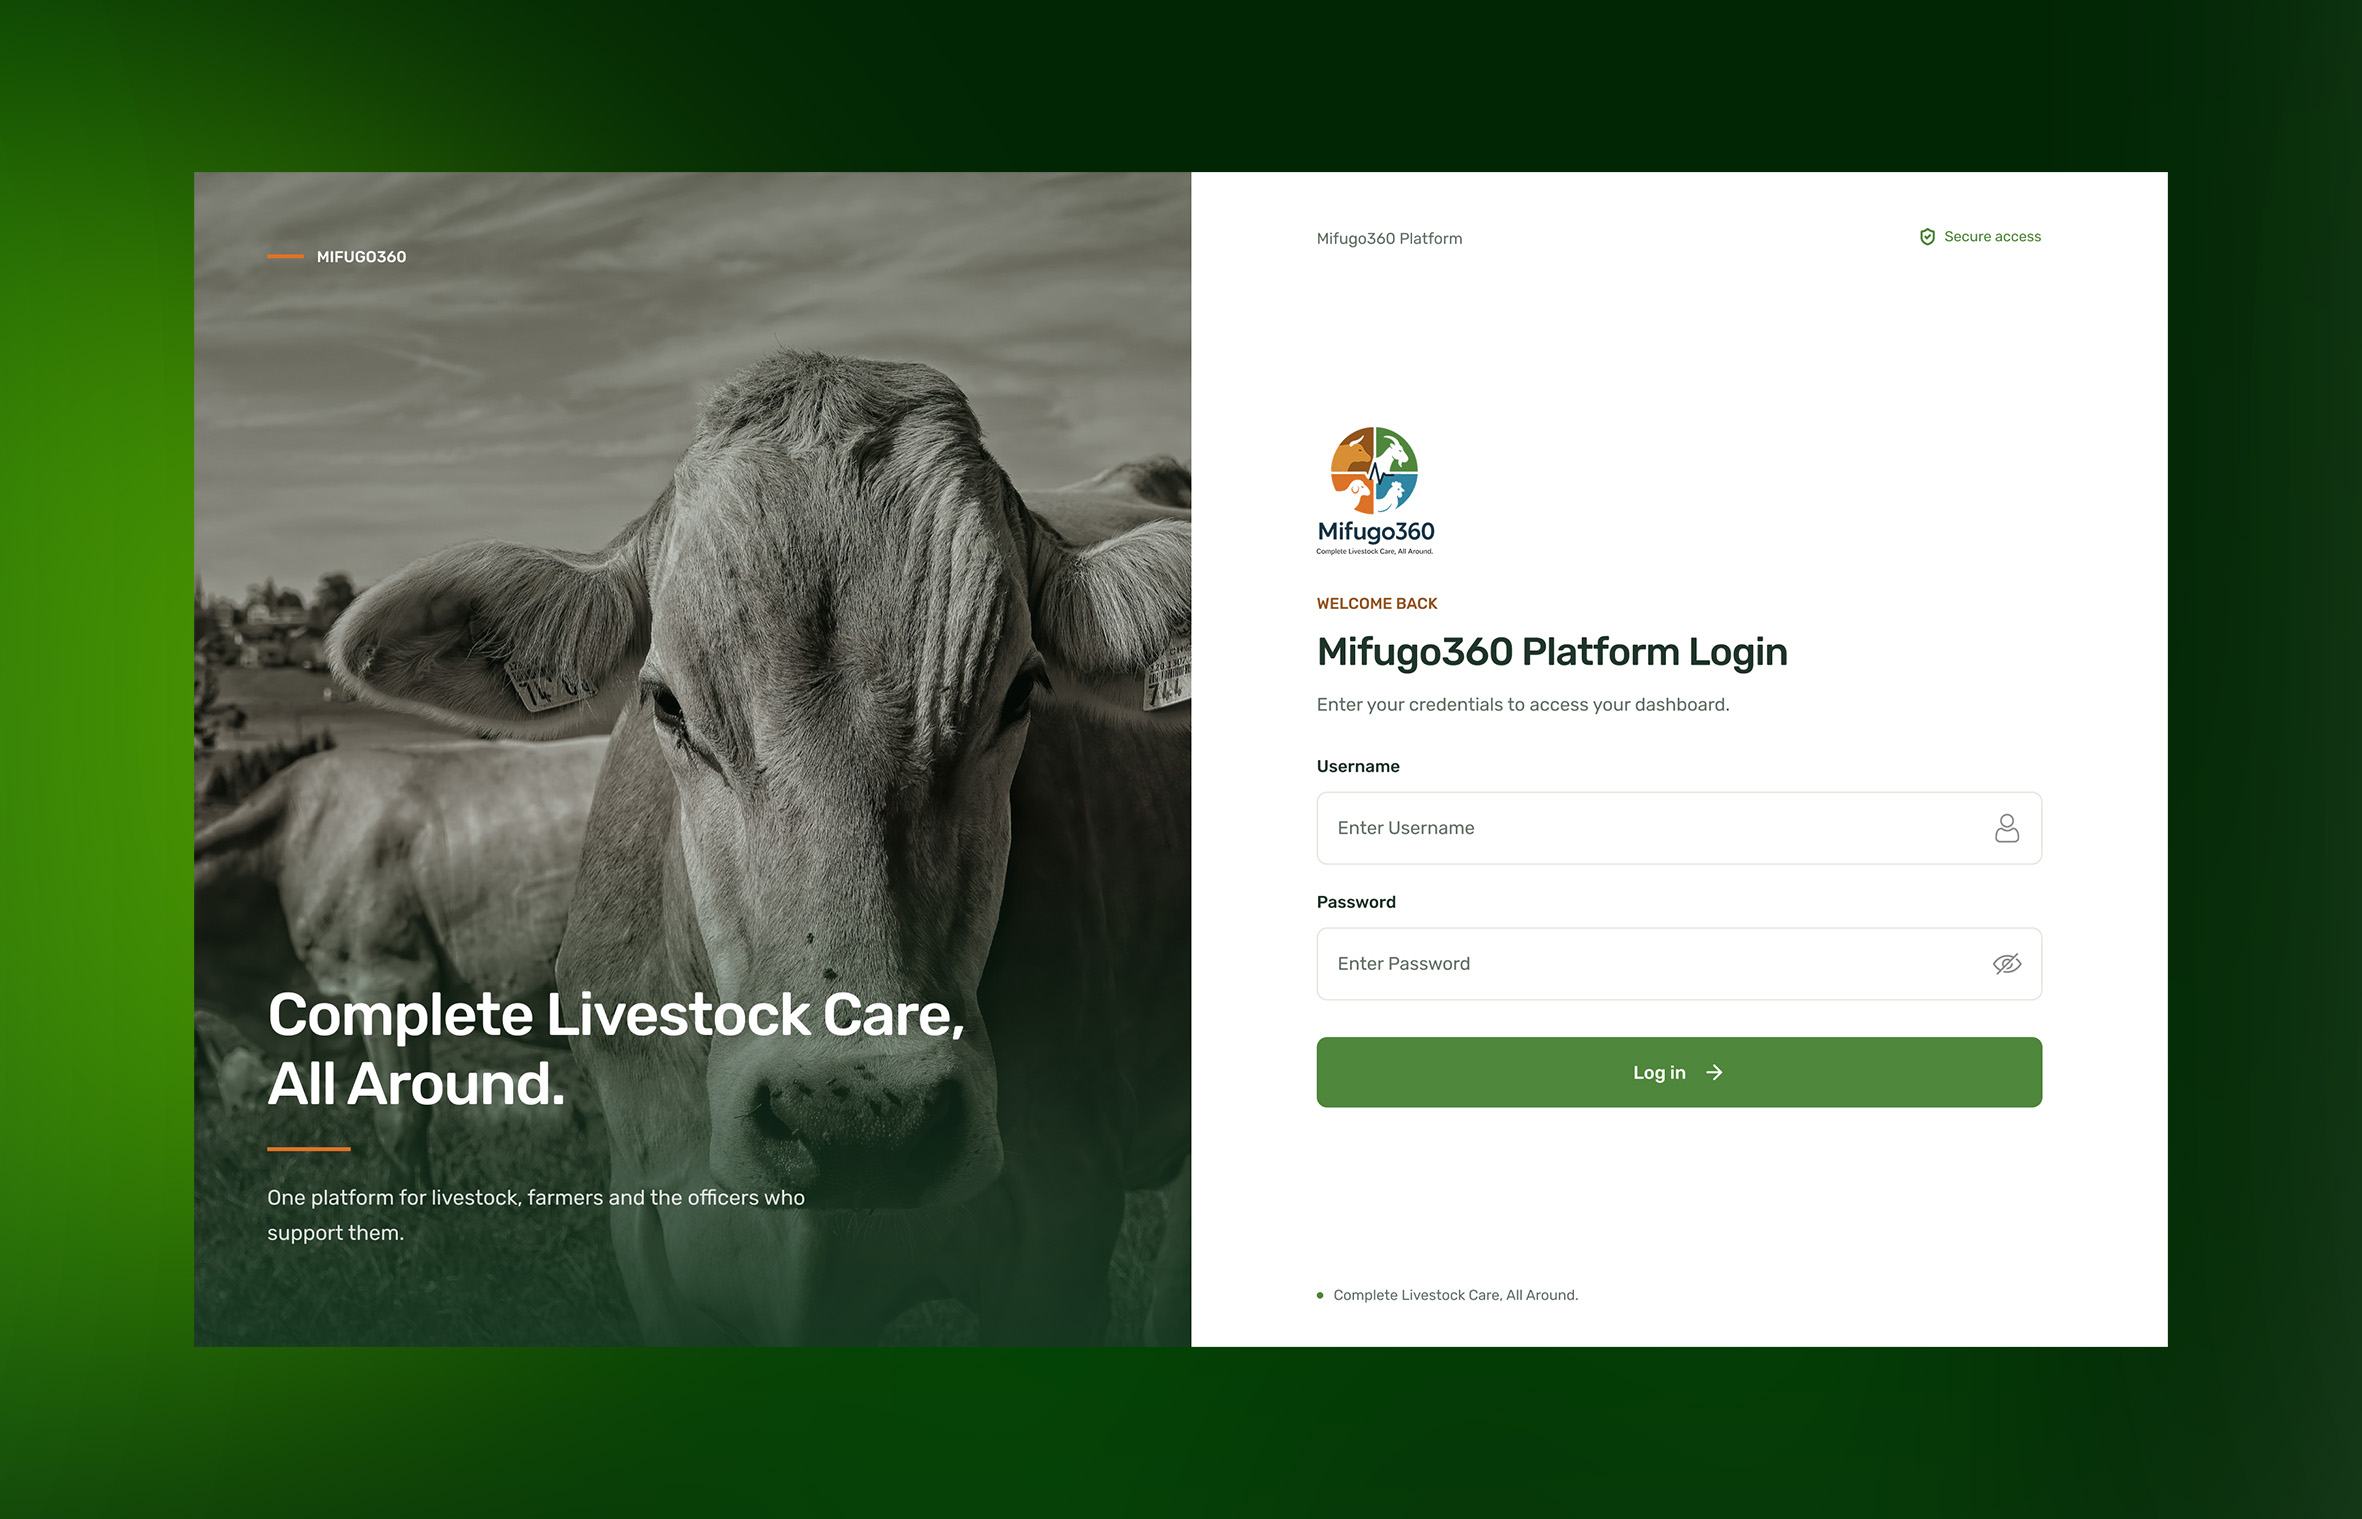
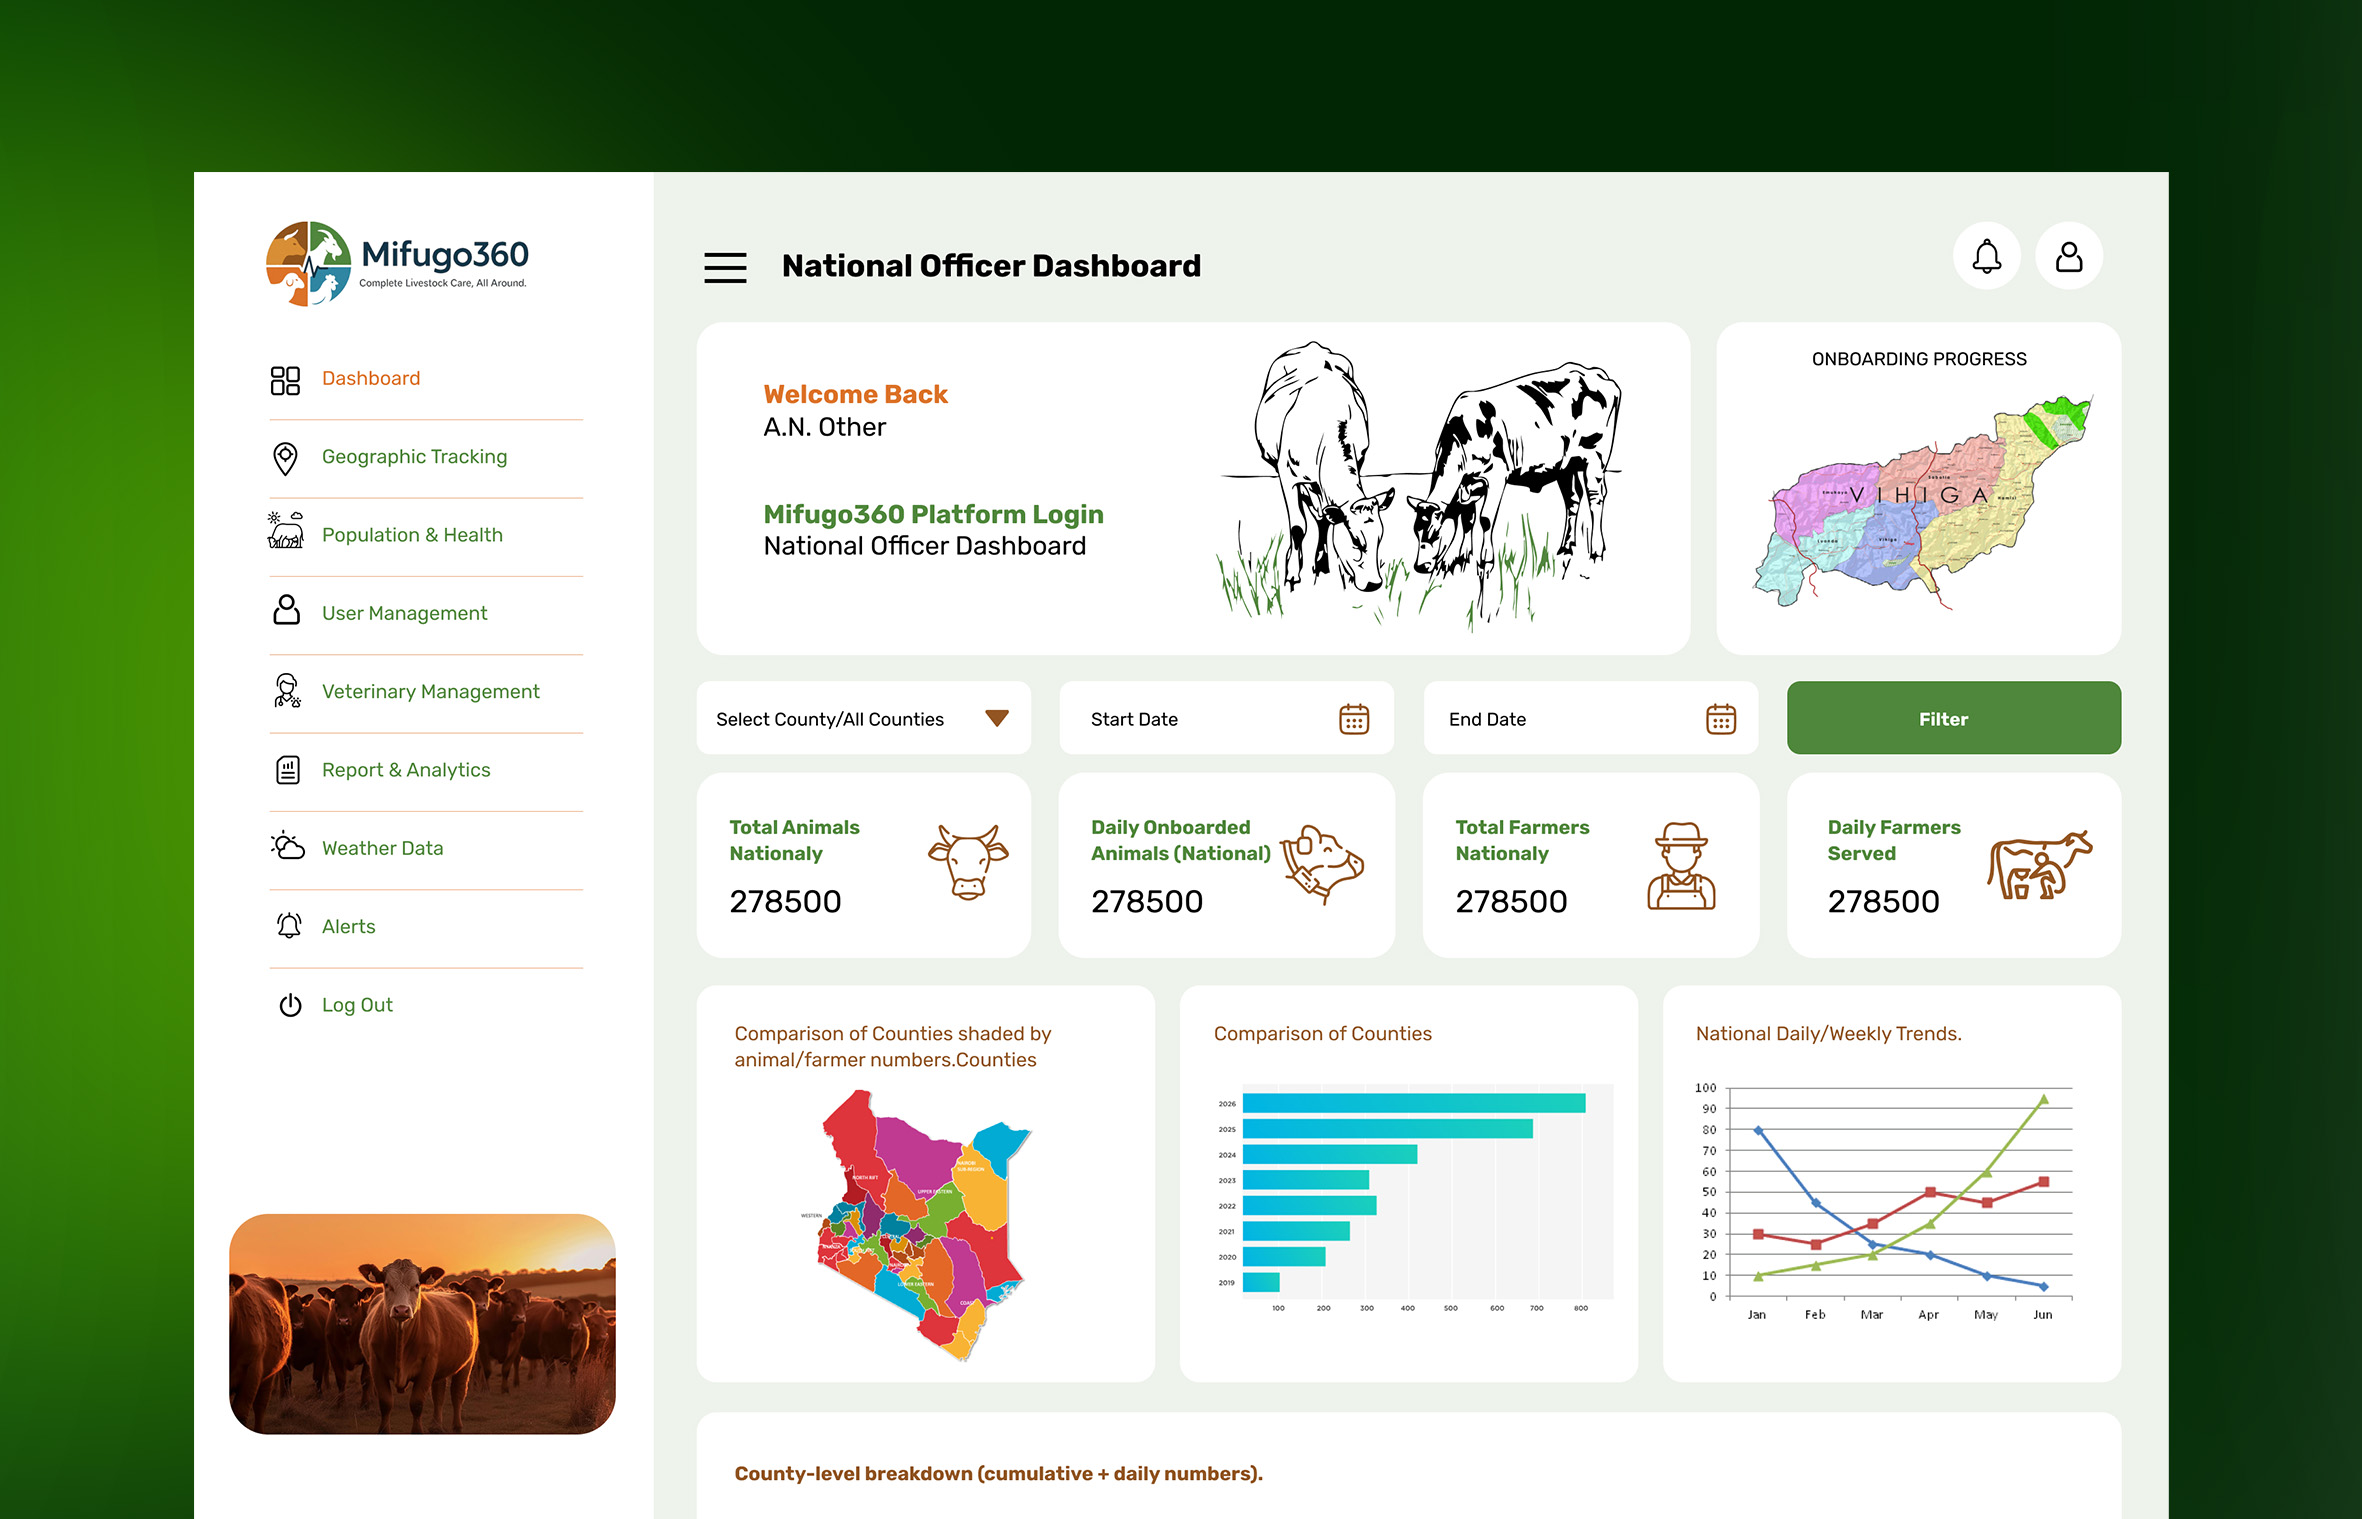
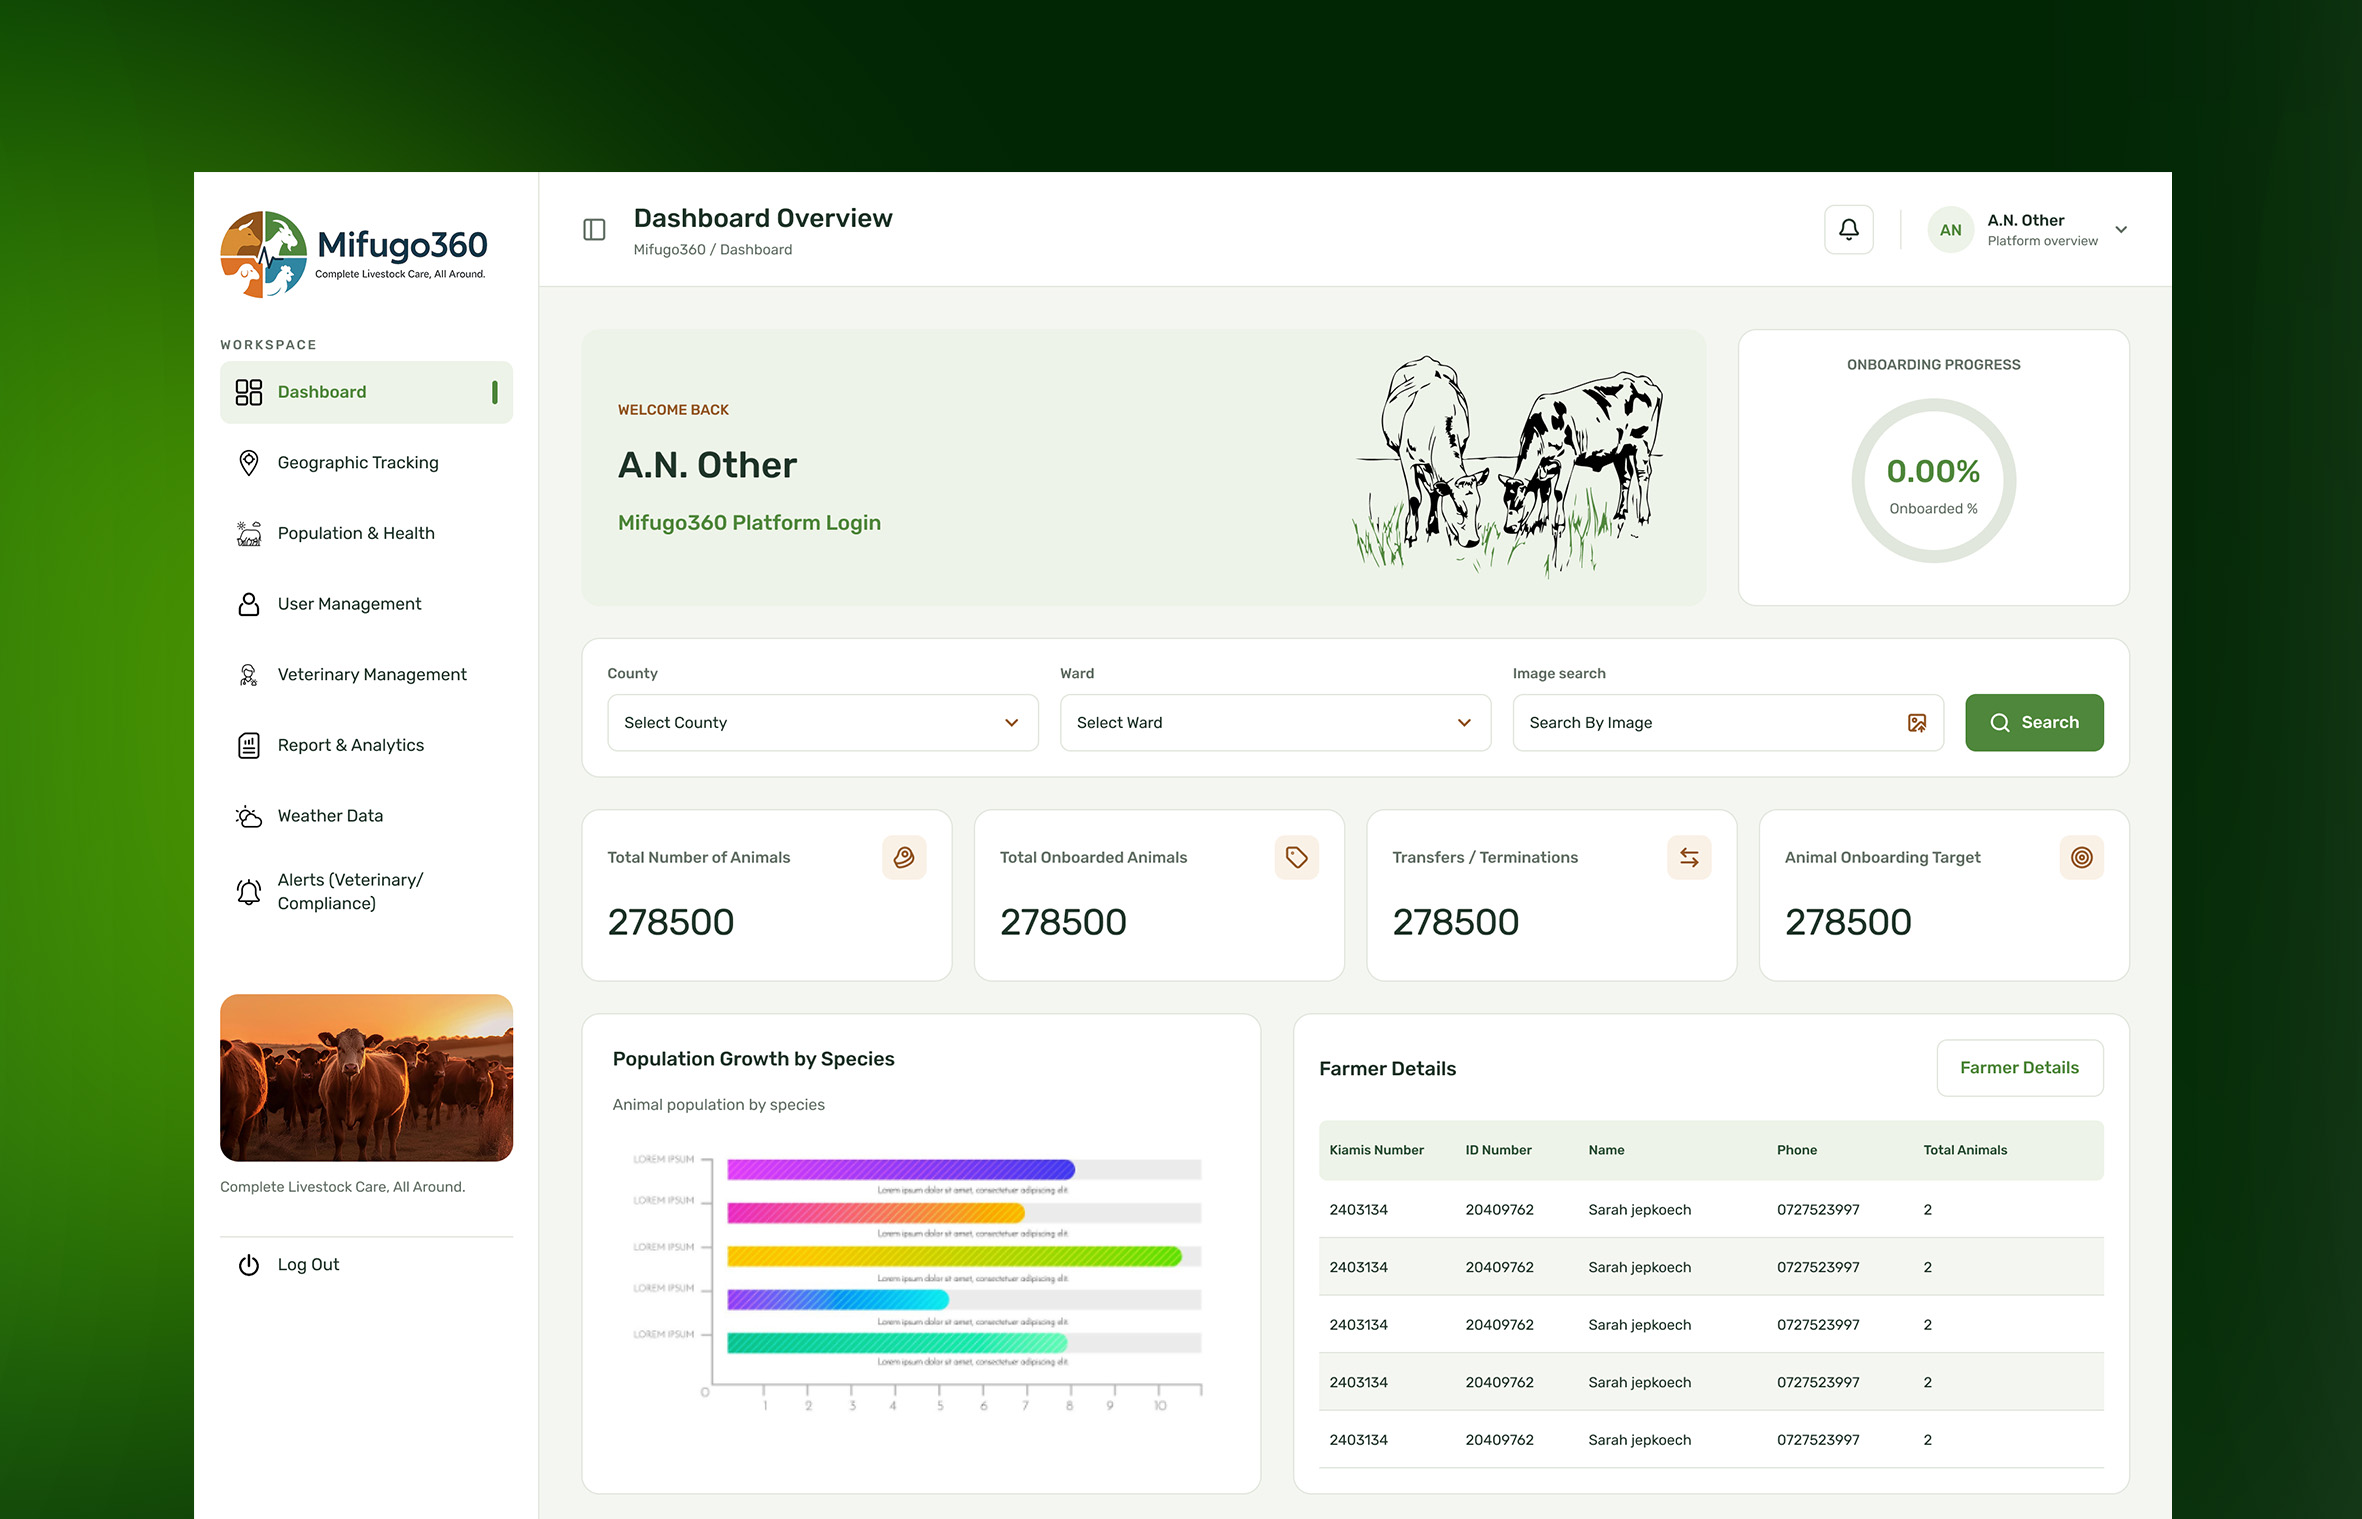
Using Figma, we explored different dashboard layouts, navigation structures, and data visualisation techniques to create a seamless monitoring experience.
Our design process prioritised: - Information architecture: Organising animal records, tracking data, alerts, and reports into logical sections. - Visual hierarchy: Highlighting critical information such as active animals, location status, and tracking alerts. - Map integration: Making geographical visibility a central component of the dashboard. - Usability: Simplifying navigation and reducing the steps required to access important information. - Scalability: Creating reusable interface components that can accommodate additional features and growing datasets.
We designed a modern animal tracking dashboard that brings essential monitoring tools together in one centralised interface.
The dashboard provides a clear overview of animal populations, location information, tracking activity, and operational alerts.
The project focused on interface design, prototyping, and establishing a consistent design language. Area Tools & methods UI/UX Design Figma Wireframing Low and high-fidelity wireframes Prototyping Interactive Figma prototypes Design System Reusable components and UI styles Data Visualisation Charts, graphs, and KPI cards Mapping Interface GPS location and map-based UI concepts Design Methodology User-centred and iterative design
The project resulted in a cohesive dashboard design concept that demonstrates how location intelligence and data visualisation can improve animal monitoring workflows.